


The scale of the melt in Greenland during the August heatwave is difficult to comprehend but satellite imagery shows the true extent of the thaw.
The scale of the melt in Greenland during the heatwave last week is difficult to comprehend but satellite imagery has shown the true extent of the thaw.
Experts have set to work to put the event into context using high-definition pictures from the European satellite network Sentinel.
Greenland's ice sheet, the second largest on the planet after Antarctica, melted at a rate of around 10 gigatonnes per day during the height of last week's heatwave.
The remaining ice has also been tainted with dust and sediment deposits — conditions that favour fast-melting as darker ice absorbs more heat and allows the development of bacteria and other microorganisms.
Pictures from Pierre Markuse, an expert in satellite imagery, show how the ice sheet has evolved between August 2018, which itself was a warm year but not as extreme as 2019, and August this year.
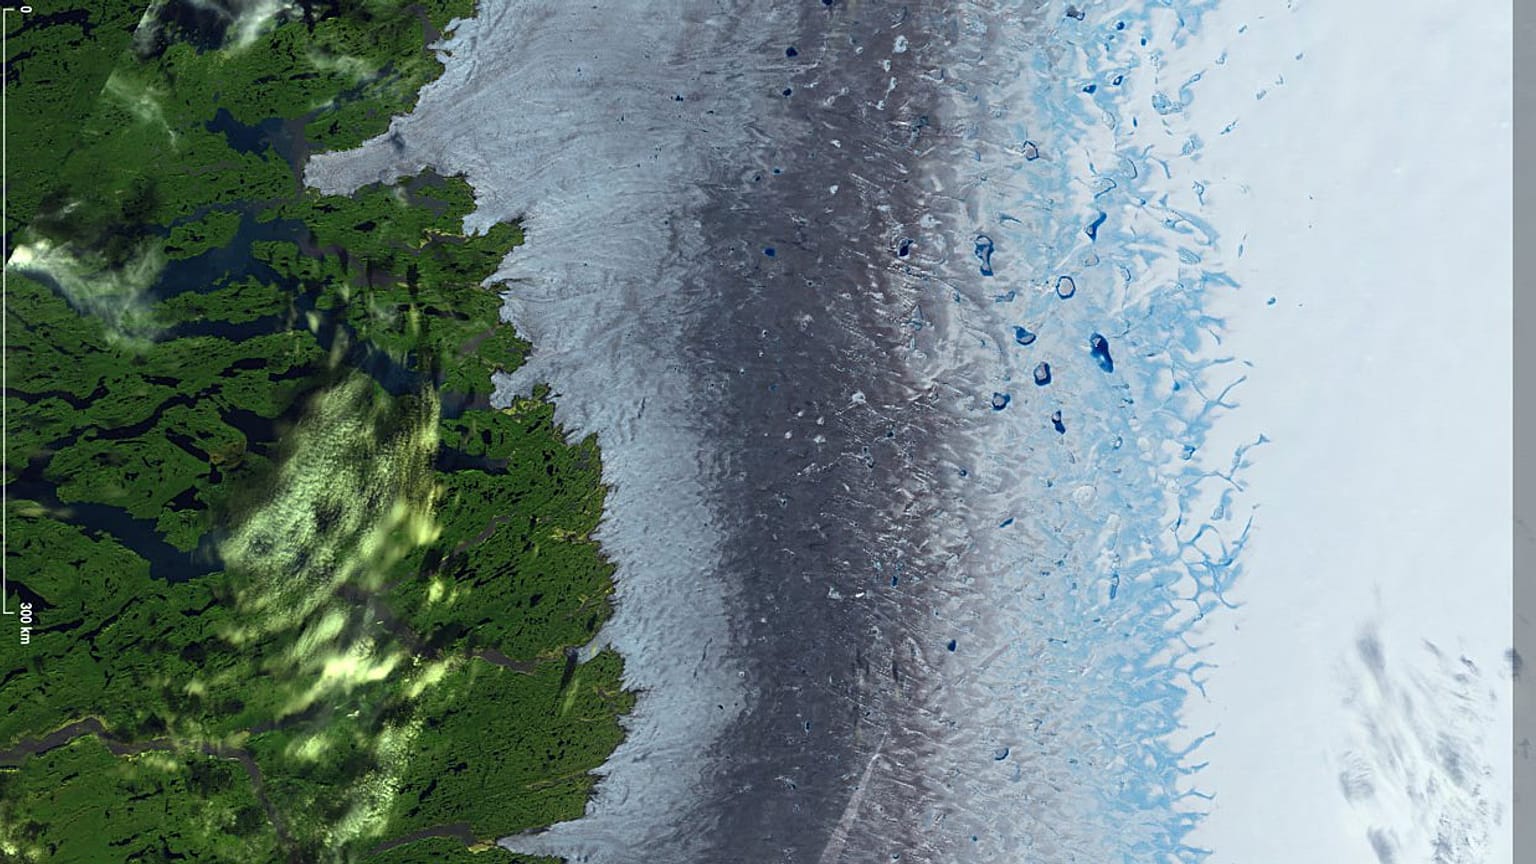
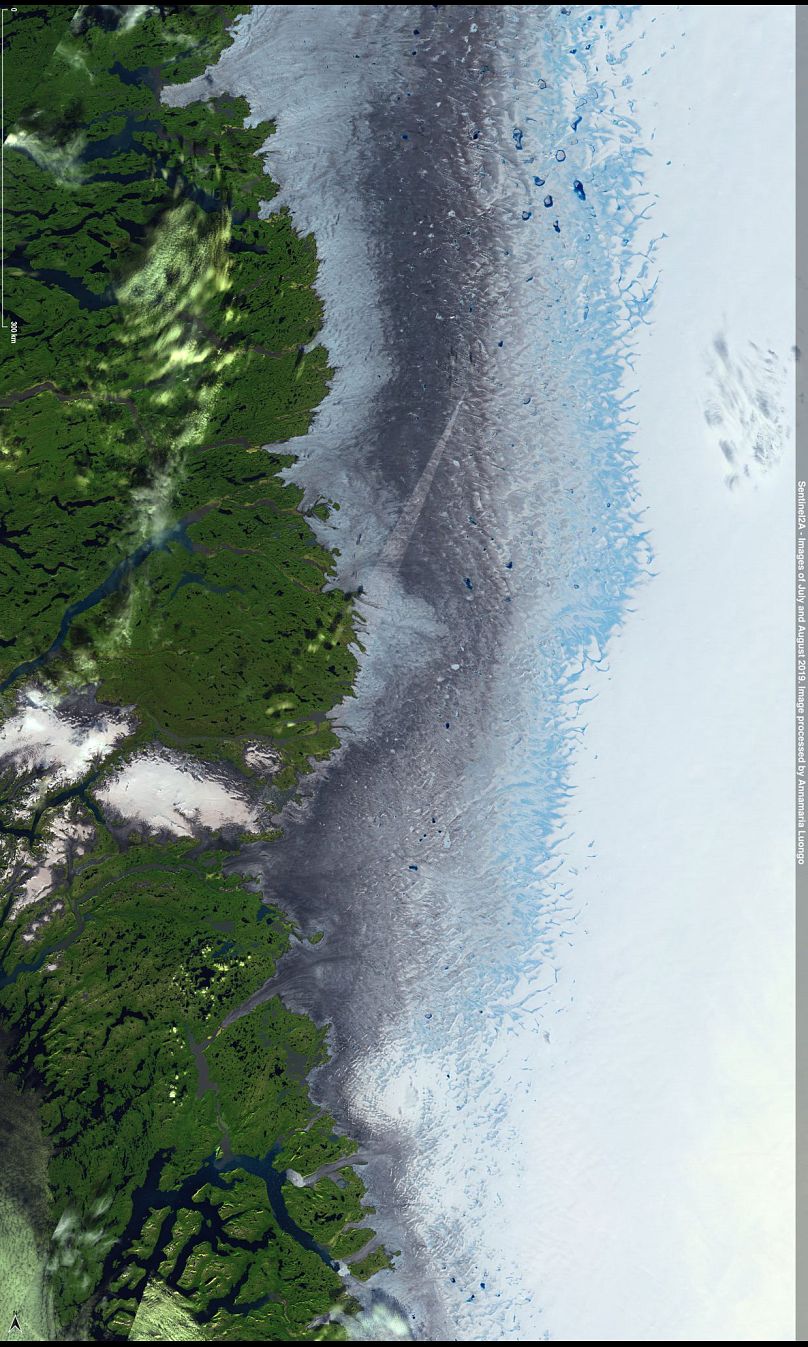
The below image shows a "dark ice" band in West Greenland, where we can see large melt ponds and how the dark area ice has widened.
Darker ice indicates a great level of melting because it is more degraded and absorbs larger amounts of sunlight.
Pictured is a 72km-wide area that measures 36km from north to south — with this in mind, the dark ice has advanced around 10km. You can move the central bar from right to left to compare the two images.
Interactive: Drag the vertical white bar across the image to compare ice sheet melt in Western Greenland (2018 vs 2019)
The original pictures are available on Markuse's Flickr account. You can also see a larger version of the slider here.
Measurements of surface melt don't take into account calving, the natural process of ice chunks breaking off from the edge of a glacier, and thawing that is caused by the ocean, so experts estimate the total ice loss is much greater.
Interactive: Drag the vertical white bar across the image to compare thawing in Kangerlussuaq in (2018 vs 2019)
Markuse also showed the amount of "meltwater" this year near Qeqqatta in the Kangerlussuaq fjord. The bridge in this area was destroyed during the great record thaw of 2012.
Satellite imagery expert Annamaria Luongo has created an impressive mosaic using images taken by the European Copernicus network's Sentinel 2 satellite showing the Western Greenland "dark ice" on different days. The image includes almost 1,500 kilometres of coastline.
Greenland keeps burning
The hot, dry weather that has been the norm through spring and summer created the perfect conditions for the spread of wildfires in Greenland, as well its "neighbouring" Arctic region of Siberia. Markuse's images put the fire, which spans roughly 6km2, into perspective.
![Contains modified Copernicus Sentinel data [2019], processed by Pierre Markuse](https://static.euronews.com/articles/stories/04/07/59/38/808x410_cmsv2_50a4d8f6-19ad-57ff-823c-16f3e2cb74e3-4075938.jpg)
A local Twitter user shared pictures from the ground.