


NASA's scientific visualisation study has updated its animation to show not only how Arctic sea ice has less surface; It is also getting thinner.
The Arctic is in a critical situation, and the thawing season of 2019 has been the most intense since a record was set in 2012.
A NASA visualisation study has produced a disturbing animation to show not only how Arctic sea ice has shrunk in surface area, but has also grown thinner, making chances of a recovery more difficult.
A colour-coded map uses white to represent ice that is older than four years, while on the other end of the spectrum, patches of grey mark ice areas that have formed in the same year.
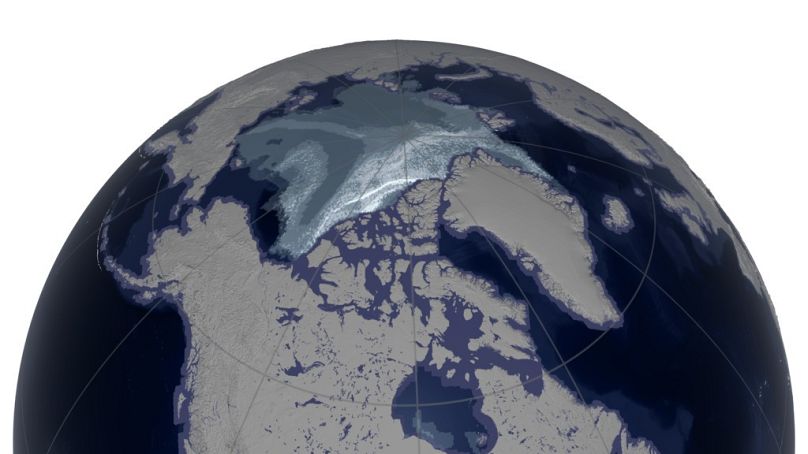
A comparison between September 1984 and September 2019 — the time of year when minimum sea ice is reached before recovery — shows a large shift.
For example, in September 1984, around 2.7 million square kilometres of ice over four years old covered the Arctic.
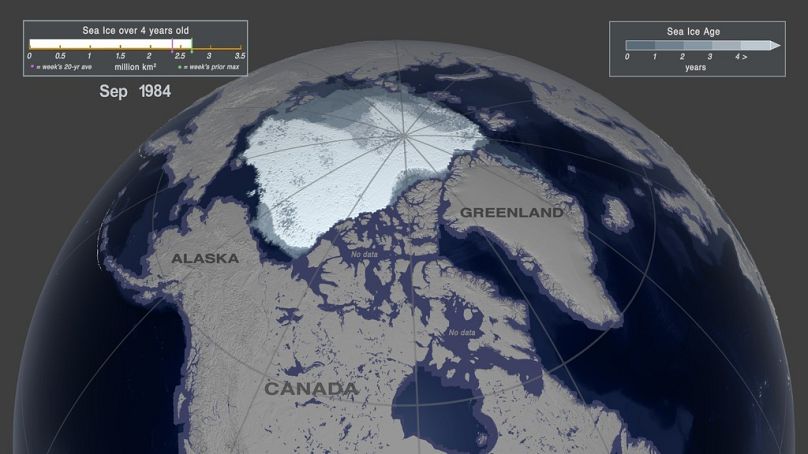
Compare this to September of this year, when just 53,000 square kilometres cover the same area.
In its latest report, a UN panel of experts on climate change warned of ice melting globally but gave particular focus to the Arctic, which is losing surface, the amount of snow located there, and the thickness of its ice cap.
It added that the volume of Arctic sea ice has been reducing since 1979 and is creating a chain reaction, known as Arctic amplification, that accelarates the warming of the region.