


The stock markets that were supposed to pay the highest price for the Iran war are now the ones leading the 2026 league table, and the rebound from March's Hormuz panic has been one of the most aggressive relief rallies in years.
The 2026 market story has unfolded in three acts, and each one has been more dramatic than the last.
The first ran from January through late February, when global equities rode a wave of expected central bank cuts and a memory-chip supercycle that pulled Korean and Taiwanese benchmarks to record highs.
The second began on 28 February, when joint US-Israeli airstrikes set off what is now the Iran War.
The third, and the one we are currently living through, started in early April when a Pakistan-mediated ceasefire proposal pulled markets off the mat.
In between those acts, the damage was enormous. Brent crude surged past $120 a barrel after the closure of the Strait of Hormuz on 4 March.
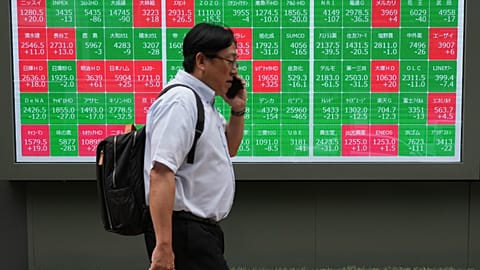
Korea's KOSPI index — which had rallied more than 50% in the previous two months — recorded a 19% drop in March, its steepest monthly slide since October 2008.
The S&P 500 drifted within a hair of correction territory. European indices tumbled as economists warned of rising stagflation risk.
Then the tape turned.
On 31 March, Pakistan and China delivered a five-point peace initiative calling for an immediate halt to hostilities.
The following morning, Donald Trump posted on Truth Social that Iran had requested a ceasefire, conditional on the Strait being reopened. On 7 April, he formally announced a two-week ceasefire with Tehran.
Oil prices have since tumbled nearly 25%, handing equity markets across the globe a relief rally already written into the history books.
How top stock markets fared in 2026
The table below shows the best-performing major country equity benchmarks year-to-date through 21 April 2026, according to Investing.com's Major World Indices screener.
Why Korea keeps winning
Korea leads the table by a margin that looks almost implausible compared to its peers. The KOSPI's 51.59% year-to-date gain is roughly 13 times the S&P 500's return and nearly double Turkey's high-inflation-driven rally.
For context, the American benchmark is up just 3.85% on the year. The Nasdaq sits at 5% and the pan-European Euro Stoxx 50 at 3.40%.
The KOSPI's resilience has a concentrated answer.
Samsung Electronics Co., Ltd. and SK Hynix Inc. together account for around 41% of total KOSPI market capitalisation and both are up close to 80% year-to-date.
The memory-chip supercycle is the engine. Samsung's preliminary first-quarter 2026 operating profit of 57 trillion KRW was a record, up 185% sequentially, driven by AI-related DRAM and high-bandwidth memory pricing.
SK Hynix has locked in long-term agreements with cloud and GPU customers that analysts describe as a structural extension of the memory shortage.
This concentration cuts both ways: it is why Korea led the world before the war, why it fell hardest during it and why the recovery has been so violent.
Goldman Sachs analysts flagged the opportunity early. In a 6 March research note, at the depth of the Korean drawdown, they described the selloff as "a correction that will likely be followed by a recovery to new highs after a period of consolidation".
That call has aged well.
How country ETFs have held up
The rankings look very different when measured from the day the war began.
According to CountryETFTracker, these are the top 10 country ETFs since the 27 February 2026 close — the session before the US-Israeli strikes on Iran.
Notably, the iShares MSCI South Korea ETF (EWY) is flat since the war began. The pre-war winner has, in dollar ETF terms, given back every point of its post-Hormuz recovery to cover the March drawdown.
The leaders on this measure fall into three buckets: oil-linked winners (Saudi Arabia, Norway, Brazil, Colombia), tech hubs that held up through the crisis (Taiwan), and high-beta emerging markets (Argentina, Turkey, Poland).
Hormuz ceasefire winners
The third measure starts from the pre-ceasefire low. Taken from the 30 March close, the rebound looks even more dramatic.
CountryETFTracker data for the best-performing country ETFs since that date.
South Korea ranks first, Taiwan second. Both are Asian manufacturing hubs that had been punished hardest for their dependence on Middle East crude.
Greece in third place is the quieter signal. The Greek market has none of Korea's semiconductor leverage, but its bank-heavy benchmark rallied on the ceasefire, on falling oil, and on the possibility that the ECB can now avoid the rate-hiking cycle the war had forced upon it.
Poland, the Netherlands, Sweden and Austria tell the same story in different accents.
What the three screeners tell you
The 2026 league table measures three things at once: who came into the year strongest, who had the least to lose in the shock, and who had the most to win back.
Korea is the only market that appears at the top in two of those three cuts — and that is why it is the single most important equity story of 2026 so far.
The catch is that Trump's two-week ceasefire is running out.
The agreement expires this week, with talks under way in Islamabad to produce either an extension or a collapse. As of Monday, the Strait had not been fully reopened, and both sides had already accused each other of violations.
Korea is running away with 2026. But the next two weeks will decide whether April was the launchpad or the peak.