


Residential electricity and gas prices in the EU remain above the levels seen before Russia’s invasion of Ukraine. Compared to the highly volatile years of the energy crisis, prices have largely stabilised as of 2026.
Russia’s invasion of Ukraine has entered its fifth year after starting in February 2022. Over these four years, consumer energy prices across Europe have been heavily affected.
Russia’s share of EU pipeline gas imports fell sharply from around 40% in 2021 to about 6% in 2025, according to the European Council, following Moscow’s invasion of Ukraine and the subsequent wave of EU sanctions, embargoes and efforts to diversify energy supplies.
Energy markets were already volatile before the invasion, but the war intensified the pressure. Prices have been more stable across the EU over the past two years.
However, household electricity and natural gas costs remain above pre-invasion levels in many countries.
So, which countries have seen the biggest increases since the invasion? And how have consumer electricity and natural gas prices changed across European capital cities?
Eurostat releases energy price data twice a year, with the latest update covering the first half of 2025.
Between the first half of 2021 and the first half of 2025, household electricity prices in the EU rose by 30%, from 22 c€/kWh to 28.7 c€/kWh. Over the same period, natural gas prices climbed by 79%, from 6.4 c€/kWh to 11.4 c€/kWh.
The Household Energy Price Index (HEPI), compiled by Energie-Control Austria, MEKH and VaasaETT, tracks monthly energy prices across European capital cities. Data for January 2026 provide the latest snapshot for comparison.
According to HEPI, residential end-user electricity prices rose by 5% across EU capitals between January 2022 and January 2026. However, prices had already begun climbing before the invasion: between January 2021 and January 2026, the increase reached 38%.
Over this five-year period, the surge was particularly sharp in several cities, more than doubling in Vilnius (102%). Increases also exceeded 60% in Bucharest (88%), Bern (86%), Kyiv (77%), Amsterdam (75%), Riga (74%), Brussels (67%) and London (64%).
Only two European capitals recorded declines over the period: Copenhagen (-16%) and Budapest (-8%).
Among the capitals of the five largest economies, London (64%) and Rome (54%) recorded notable increases. Madrid (13%) and Berlin (15%) saw the smallest rises, while Paris (31%) remained below the EU average.
Experts at the European Energy and Climate Policy (IEECP) say the electricity mix plays a key role in how countries are affected.
In some countries, such as Spain, wind, solar and hydropower account for a large share of generation. They also note that Nordic countries benefit from strong renewable output — including hydropower, geothermal and wind — which reduces their exposure to fossil fuel price volatility.
Comparing only January 2022 with January 2026 shows a different picture, with several cities recording declines led by Copenhagen (-44%).
London (-22%), Madrid (-17%), Berlin (-14%) and Rome (-4%) also posted decreases over this four-year period, while electricity prices in Paris rose by 21%.
Vilnius recorded the highest increase within the EU (70%), while Kyiv (87%) topped the overall list.
The chart below shows that electricity prices were highly volatile in the earlier years before stabilising in 2025 and 2026.
These changes are measured in euro terms. Where national currencies are used, part of the shift may also reflect exchange rate movements.
Between January 2022 and January 2026, residential end-user natural gas prices edged down by just 1% across EU capital cities. Some cities recorded significant declines, including Berlin (-41%), Brussels (-40%) and Athens (-40%).
Others saw sharp increases, led by Riga (89%), followed by Warsaw (55%) and Lisbon (55%).
January 2021 gas price data are not available, with November 2021 the latest release prior to 2022. Even relative to January 2022, the earlier data illustrate how sharply prices were already rising ahead of Russia’s invasion.
Between November 2021 and January 2026, natural gas prices across EU capitals increased by 24%.
Warsaw recorded the largest rise (88%), followed by Bratislava (85%), Lisbon (77%) and Prague (70%).
A few cities saw declines, led by Kyiv (-35%), followed by Bucharest (-33%) and Brussels (-18%).
Among the capitals of the largest economies, London (-13%) was the only one to record a decline.
Berlin (39%) and Paris (28%) were above the EU average while the increase reached 16% in Madrid and 23% in Rome.
As with electricity, natural gas prices have been relatively stable over the past two years as of early 2026. Amsterdam was among the most volatile cities during the early phase of the energy crisis.
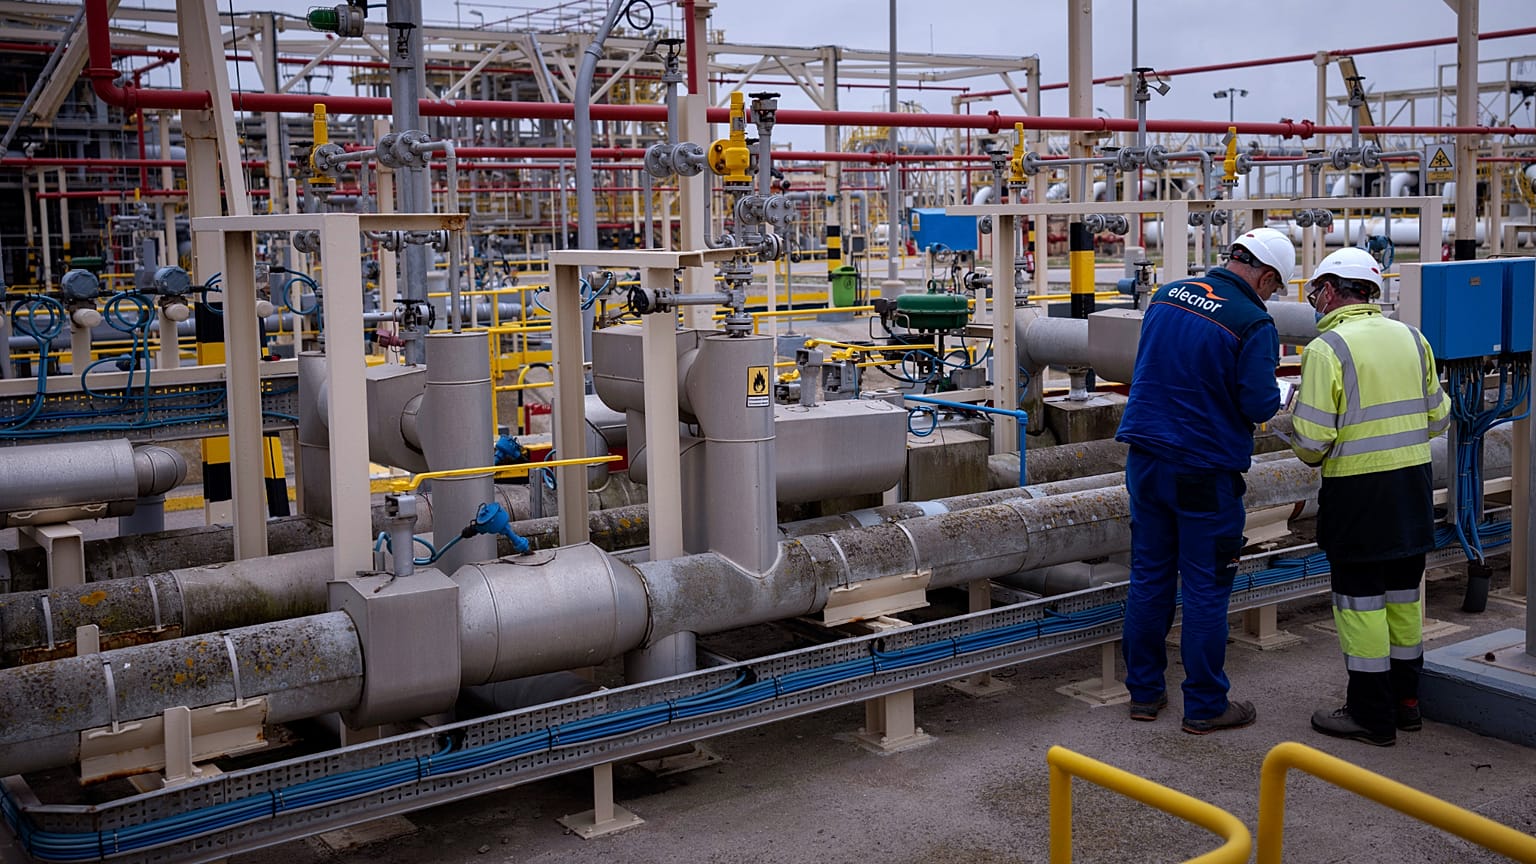
IEECP researchers attributed rising gas prices in the Netherlands to the suspension of production at the Groningen gas field due to earthquake risks.
They added that some countries, including Germany and Austria, were highly dependent on natural gas imports from Russia, and that this reliance played a role in price developments during the crisis.
Highest and lowest energy prices in Europe
Based on HEPI data, a recent Euronews article takes a close look at electricity and gas prices across Europe, showing the most expensive and cheapest cities in 2026, both in euro and in purchasing power standards (PPS).
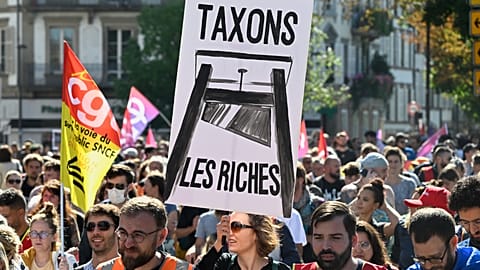
European countries apply different tax policies to household energy prices. As a result, the share of energy taxes and VAT in electricity and gas bills varies significantly across the bloc. This Euronews article examines how much of the final energy price is made up of taxes.