


The European record heatwave of July is stuck in Greenland, causing an exceptional melt season, very close to the 2012 record. These pictures sum up the scale of the situation.
The sweltering heatwave that hit Europe last month has moved north to Greenland and the planet's second-largest ice sheet.
It's triggered an extreme melt event that could rival the record 2012 season and fuelled a rare wildfire close to Qeqqata, burning since early July.
Satellite imagery expert Pierre Markuse has today published a photo that encapsulates what is happening in Greenland.
Using the EU's Copernicus network Sentinel 3 satellite, the image taken on August 1 in western Greenland shows the smoke of the active wildfire (left) and the ice sheet with countless melt ponds (the blue "dots"). In addition, there is a large area of "grey" ice. Darker ice, absorbs more solar radiation and so melts quicker.
![Contains modified Copernicus Sentinel data [2019], processed by Pierre Markuse](https://static.euronews.com/articles/stories/04/07/07/38/808x668_cmsv2_3920d4ce-765b-5e75-9dd5-112ae9c64558-4070738.jpg)
Danish Meteorological Institute's Climate scientist Ruth Mottram says the paler spots in the dark band "might indicate where supraglacial lakes have drained".
The organisation's Greenland ice Twitter account explains "the famous" west Greenland dark band is composed of dust accumulated in the lower ice layers "from the glacial age ice" and that "provides the perfect conditions for algae and bacteria to grow and further darken the ice, accelerating melt in this region".
Finnish scientist Antti Lipponen shows the evolution of roughly the same area since 2001. In the animation we can clearly appreciate the ice sheet narrowing. He also made an animation showing Greenland's rapid melt since May. You can watch the videos on the player above.
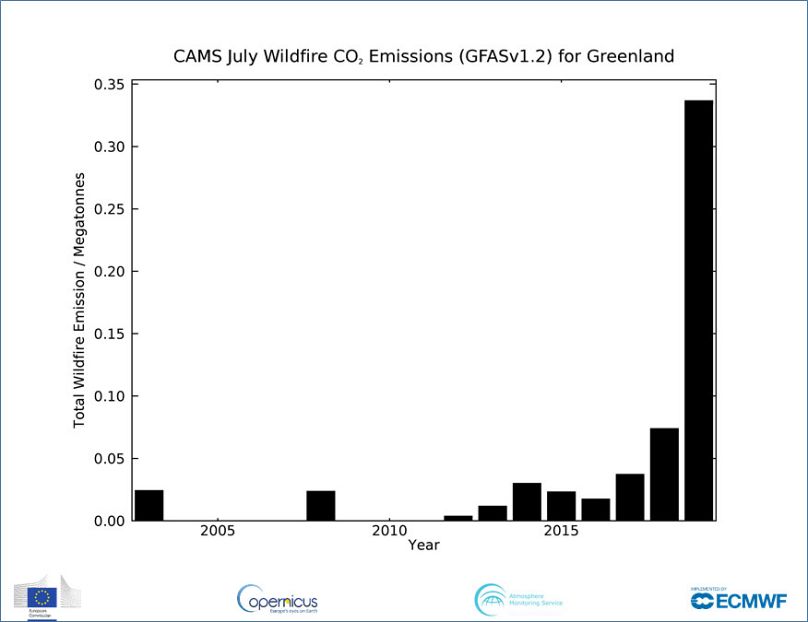
How unusual are wildfires in Greenland?
Copernicus Atmosphere Monitoring Service senior scientist Mark Parrington has shared a graph showing how exceptional is to see a wildfire burning since early July.
This year has seen the most CO2 emissions from wildfires in Greenland since measurements began 17 years ago.
Pierre Markuse's expertise allows us to have a closer look at the Qeqqata wildfire, which is affecting an area of about 5.2 square km.
![Contains modified Copernicus Sentinel data [2019], processed by Pierre Markuse](https://static.euronews.com/articles/stories/04/07/07/38/808x410_cmsv2_46e3d2f5-3483-5baf-8836-c29bba6ba1e5-4070738.jpg)
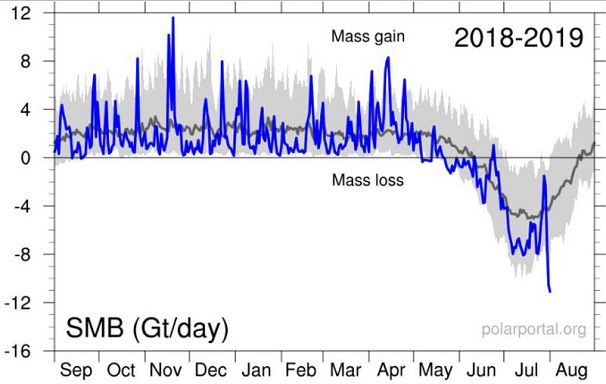
What about the melt?
This extreme melt event is not the largest on record. But the warm weather will be stuck in Greenland for the coming days, according to the forecasts.
Still, the August 1, the melt measured 11 gigatonnes of water. "Enough to flood the whole Germany with 7 cm," according to climate scientist Martin Stendel.
Scientists are especially concerned because the high temperatures have reached exceptionally high altitudes this summer.
UN Secretary-General Antonio Guterres said on Thursday the extreme melt event in Greenland takes place "at a time when Arctic Sea ice is already near record low levels".
"Preventing irreversible climate disruption is the race of our lives and for our lives," he said. "It is a race we can — and must — win."
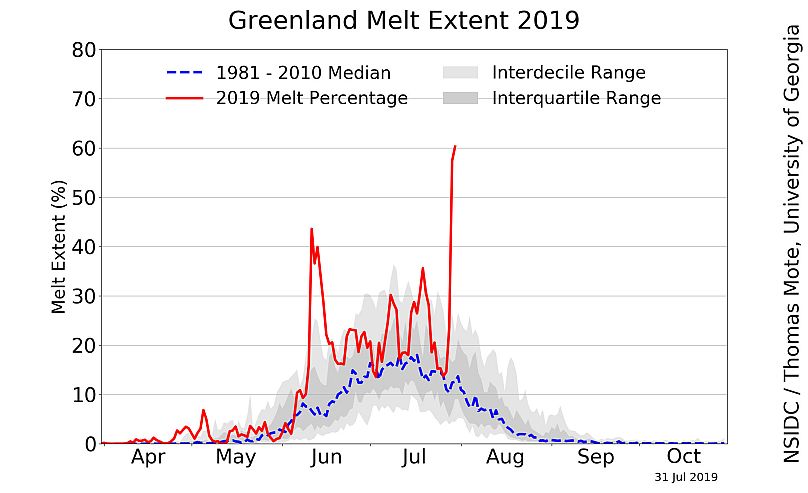
The US Snow and Ice Institute data is not yet updated for August 1, but the July 31 surface melt extent graph shows how exceptional it has been until now.
From the ground, US author Laurie Garrett, shared on Twitter this video of the melting water in Kangerlussiauq, by 22º C. Scientist Jim McQuaid said the bridge where the filming took place was rebuilt recently after the record 2012 melt.