“Record breaking temperatures are newsworthy, but not very surprising from a scientific point of view”
Last week, the Copernicus Climate Change Service (C3S), implemented by the European Centre for Medium-Range Weather Forecasts (ECMWF) on behalf of the European Commission, launched its flagship annual publication, the European State of the Climate Report 2019, which looks at the climate conditions, trends, and extreme events that have defined last year, and at how those fit into the trends of the last few decades. This report can provide a good understanding of what the future may look like so that any sector can adapt and become more efficient, particularly in the framework of the European Green Deal.
Carlo Buontempo, Copernicus Climate Change Service Director, speaks about the report’s main findings and what they might mean for Europe’s future.
Many of the climate indicators in the report confirm Europe is on a warming trend. What made 2019 stand out and what should be our main take-aways when it comes to temperatures?
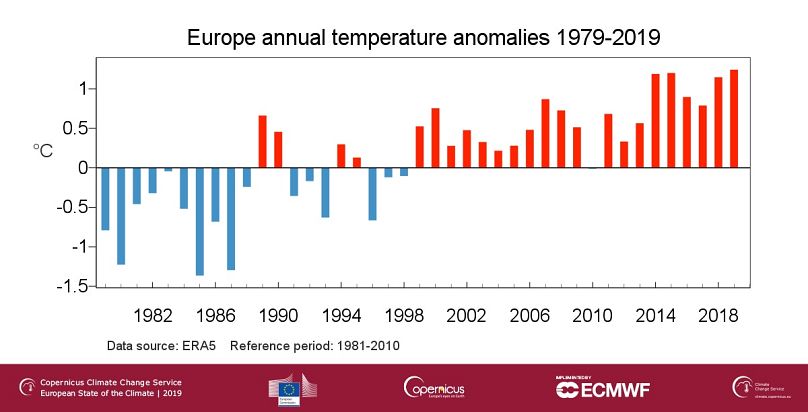
Carlo Buontempo: 2019 was the warmest on record in Europe, and above average in most locations on the continent. You would usually have warm, as well as cold anomalies, but last year was uniformly warm, so quite extraordinary. But while record-breaking temperatures are newsworthy, from a scientific point of view, it’s not very surprising, as we know that the climate is warming. We see these hot record-breaking events becoming more frequent, more than you would expect if they were only due to climate variability. We see that 11 years out of the last 12 have been the warmest on record; this is not a strange statistical fluctuation – this is a result of the warming climate.
How much warmer has 2019 been compared to other warm years?
It’s not just one spike that’s incredibly bigger than anything we’ve seen before. 2019 was warmer than any other year, but it was quite close to 2014 and 2015. It’s almost a cluster of warm years, nearly 1.3°C warmer than in the 1970s. The fact that they are clustering is very likely a consequence of the warming climate system. The underpinning is that the climate is warming unequivocally everywhere in Europe and the main drivers are anthropogenic greenhouse gas (GHG) emissions.
So what should we expect next?
For temperatures to go up. This is what the model is saying, as well as our observations. On top of natural climate variations there is an underpinning trend. There is always a chance of having a cold year, but that probability is reduced in the future because of this warming trend. We don’t know exactly how warm future years will be, but on the balance, they are likely to be warmer than we have seen.
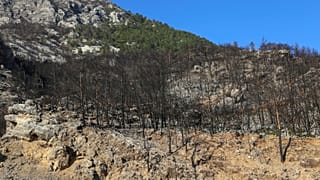
How has the heat affected daily life in 2019?
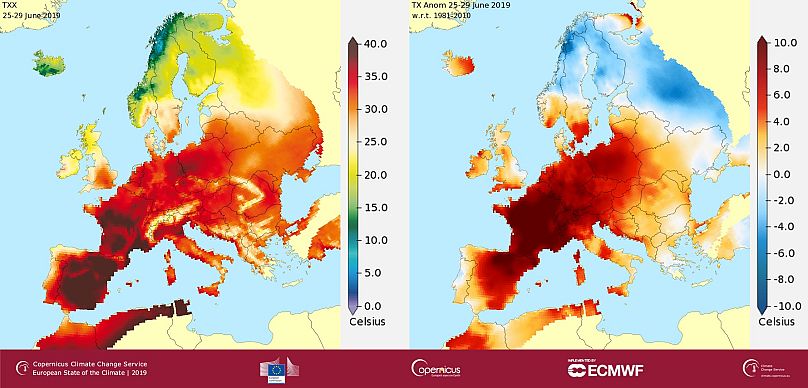
Last year we had not only the warmest on record, but also several heatwaves: one in February, when temperatures jumped above 20° C in some regions, followed by those at the end of June and July – record-breaking events all across France, Germany, Italy, Spain, and the UK. These extreme events were superimposed onto a warm season and they can give you an idea as to what a warmer climate can look like. Of course, this analogy has its limitations.
We saw that not only people, but also equipment and infrastructure across Europe were affected. Thermal expansion has been a problem for trains, leading to tracks buckling and stopping traffic in the UK, Germany, France, or Italy. Bridges, power plants, electricity distribution and generation, and agriculture also suffered. All sectors are likely to be affected by the warming climate. There needs to be a rethink of this critical infrastructure in order to cope with these changes in climate.
Last November was the wettest on record for some countries in Europe. What should we keep in mind about rainfall trends?
The extremely wet November has affected mostly Western Europe – France, Northern Spain, north of Italy, the UK, earlier affected by dry conditions. If anything, we can say it was a very diverse year: we had droughts, floods, and record-breaking events. Rainfall as a whole doesn’t have a trend at European level, as it’s difficult to identify a clear pattern. But this differs at regional level. If you look at Southern Europe, there is good evidence that even the most intense precipitation is likely to increase, even in regions likely to see a decline in overall yearly rainfall.
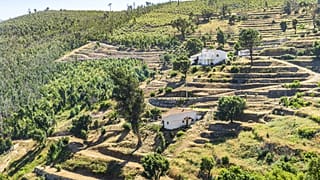
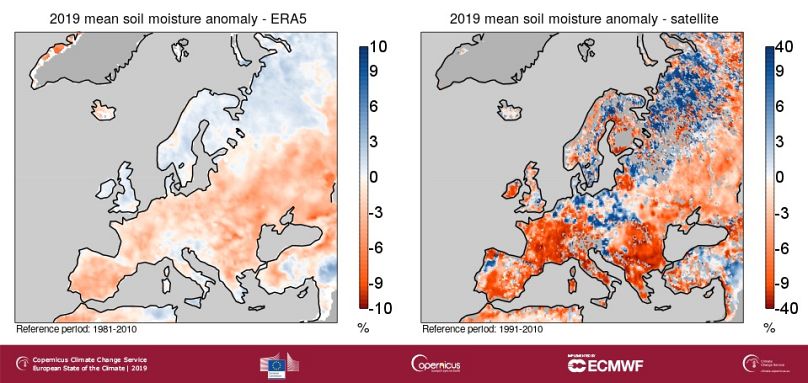
The report also points out that soil moisture in 2019 has been the second lowest since 1979. What is behind that?
The historical record at European level shows a declining trend in soil moisture. It’s not surprising. The simplest reason would be that if precipitation remains about the same, but temperatures go up, so does evaporation. Of course, different drivers might influence soil moisture according to location. Last year, we saw a swathe of negative anomalies for soil moisture stretching from Western Europe into Germany – an area one wouldn’t normally associate with drought conditions.
Record melting affected Greenland in 2019, while sea ice extension was low every month last year. What were the drivers?
The extent of the phenomenon in Greenland has been surprising, as very high temperatures caused melting over the entire ice cap. Melting of the Arctic ice was lower overall, and we also saw more sea ice than usual around the Svalbard archipelago in the winter season. This is not contradicting the reduction in sea ice we’ve seen so far; it’s very likely that in the next years we will see another minimum of sea ice, also because we have a clear feedback mechanism in the polar region, where less sea ice causes more warming, thus further melting. This is already worsening warming in the region.
How is that affecting Europe?
It is certainly affecting local climate and livelihoods, while it also generates new opportunities across the Arctic. It is likely to have an impact on the weather further away and there is a growing body of literature suggesting a strong relationship between sea ice cover in the Arctic and European weather.
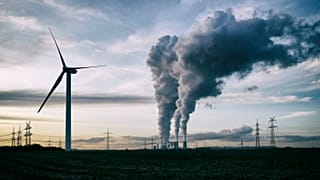
How did 2019 look from a greenhouse gas emission perspective?
Concentrations have gone up. We are not seeing a decline and that means that the drivers for the GHG effect are still there, which can only translate into further warming. We have not seen any sign of a direction change. The rhythm of increase in GHG concentrations last year has been in line with recent historical records.
The report also says Europe is warming faster than other regions. How would you explain that?
Europe was 2°C warmer in 2019 compared to pre-industrial times, while globally, the average temperature was 1.1°C higher. But there are two caveats. First, the land is generally warming faster than the ocean; and secondly, our analysis focuses on land rather than the sea, which included a significant part of the Arctic. We know that polar regions have experienced significant more warming than other parts. So this could contribute to the higher observed warming in Europe.
Any positive news the report highlights?
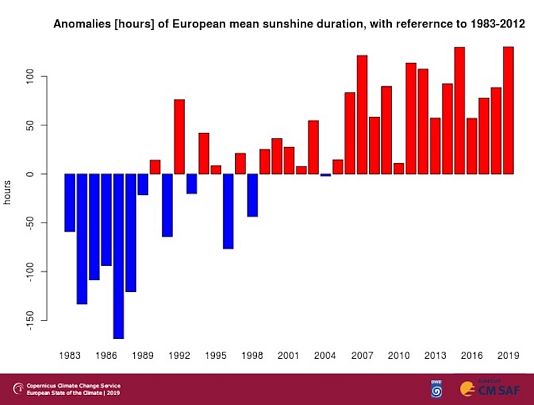
2019 was the sunniest year on record. Not just in Southern Europe, generally seeing many hours of sunshine, but also in Central and Northern Europe. And this is part of a pattern – we do see an increase in sunshine hours.
In the context of the current COVID-19 pandemic, much of the polluting human activity has come to a halt. How much can this impact future climate indicators?
We’ve seen some impact on air quality-related pollutants such as PM 2.5 and nitrous oxide, which have declined both in China and Europe, in areas prone to high pollution. There have been some claims about the lockdown leading to a reduction of GHGs, but I don’t think it will be possible to translate those into measurable impacts across climate indicators. This is due to the huge inertia within the climate system; so even if we were to stop our emissions today we wouldn’t necessarily see the results for let’s say another 20 years, if we talk about the global average temperature.
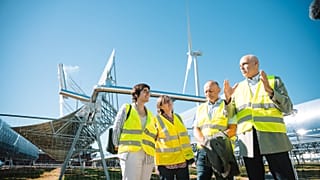
How can the report and climate data inform adaptation?
C3S likes to be the engine behind adaptation. We don’t implement adaptation strategies ourselves, we aim to provide good quality data to authorities in charge of adaptation, so they can build their plans using that information. The report is aimed at general audiences and allows them to go a bit deeper into climate information. Clearly behind the report there is a huge wealth of data and this is all available and free to use for all sorts of applications.
We now have 40,000 registered users and we deliver every day 50 TB of data. The proportion of companies, government and international organizations accessing our data has increased steadily and keeps growing since we launched the Climate Data Store. This, as well as this report is made possible due to C3S’s systematic collection of data, its infrastructure, its quality control system, and its team that supports operations almost 24/7.
Climate is no longer something we can give for granted; the climate of the past is no longer a proxy for what the future may hold for us. This means that we need to change our attitudes toward climate information and data. From transport to health, and from agriculture to insurance, many sectors need good quality climate data - not only good past records, but also an understanding of what the future may look like so they can adapt and become more efficient.

To download the summary report, click here.
To browse through the full report, click here.