


We spoke to Weather & Radar meteorologist Tamsin Green about how we record record-breaking weather.
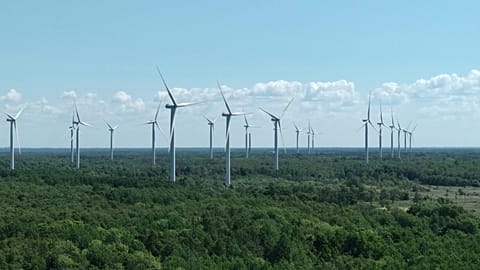
This summer headlines have been filled with news of record breaking heatwaves.
On 4 and 5 July, the planet saw its hottest days ever. But have you ever wondered how we actually record these temperatures and verify them as record-breaking?
We spoke to meteorologist Tamsin Green to find out.
How do we verify heat records?
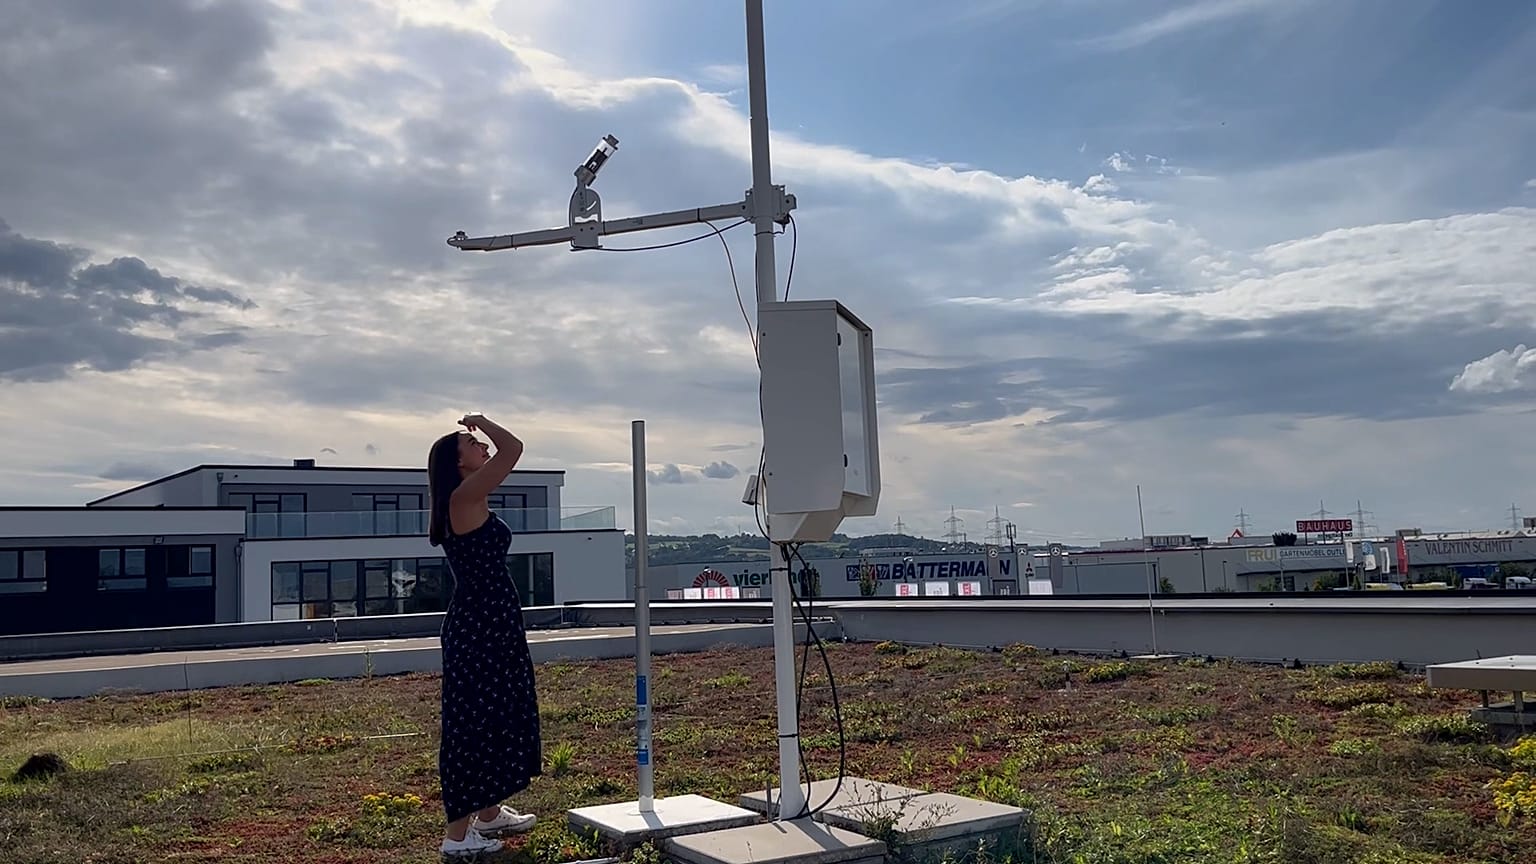
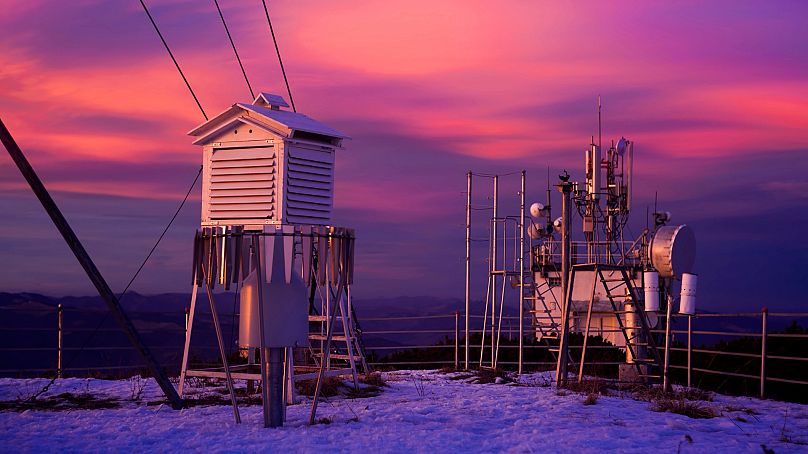
Across the world, weather is recorded in various ways, monitoring not only heat but pressure, humidity, wind speed and precipitation.
Data is collected from equipment such as weather stations, weather balloons, buoys in the ocean and satellites.
The World Meteorological Organisation (WMO) sets strict standards for these instruments to ensure data is measured in the same way across the globe.
“Temperature sensors need to be two metres above the ground, on level ground, not near any trees, any buildings. They have to be in a white, ventilated, shielded box so they're not affected by direct sunlight or anything like that and they are painted white in order to reflect the sun as well,” explains Tamsin, a meteorologist for Weather and Radar.
What might be more surprising is how long it actually takes to verify a record-breaking weather event.
The hottest temperature ever recorded in Italy was in August 2021 but was only officially verified as record-breaking on 17 July 2023. But why?
Each country has their own national meteorological service which is responsible for the weather stations in that country. The WMO has around 11,000 weather stations all around the world.
When a Met service thinks it might have a record, it submits its raw data to the WMO.
“The WMO have experts who examine this raw data and they have to assess all different things, including the type of instruments used, the environment, any calibration procedures and errors.
“[They also look at] nearby data for comparison as well because if one weather station records 45°C and one five kilometres away records 25°C, you know that seems quite obviously erroneous,” says Tamsin.
How do we know the 4 and 5 July were the hottest days ever?
The reported hottest days on the planet on 4 and 5 July broke a slightly different record and therefore verified differently than a single country’s record.
“That was data that was taken from the US National Centre for Environmental Prediction, and they realised, according to that official data, that those two days are the hottest on record and that's because they take the global average of all the official weather stations and they see that that has obviously broken the records on average,” explains Tamsin.
“So it's not a particular weather station, it's not saying this one weather station in Florida hit 40°C. It's the whole world.”
What does my weather forecast mean?
As a meteorologist, Tamsin is an expert on all things weather. So what is her advice on how exactly to understand the forecast you might see on TV or on your phone?
Tamsin says that when you see a temperature on the forecast, that’s the air temperature (measured from 2 metres above ground), not the ground temperature, which is often considerably warmer.
Sometimes we see the ‘feels like temperature’ which according to Tamsin is a less meteorological term and is just there to help us understand what we’re facing (and often what we’ll wear).
“It takes into consideration not just the air temperature, but also any wind chill, heat index, things like that,” Tamsin says.
“It could be you look at the forecast in winter and it could say it's 10°C outside, but there could be a really strong, bitterly cold northerly wind blowing in and that will make that temperature feel a lot colder than it actually is.”
There’s also been a lot of speculation over the past few years about what the rain percentage information actually means.
Despite a popular (and incorrect) TikTok video that circulated, Tamsin confirms that the percentage is the chance that you’ll see rain in that area, not the percentage of that area that will get rain.
“In the case of showers, it's just so incredibly difficult to pin down their timing and their location exactly.
“If you have a frontal band of rain move in, you can identify more clearly the time that that will arrive because it's more dynamic. Showers, they pop up and they form and dissipate over very short periods of time, most of the time and in very localised areas.”
Tamsin’s biggest advice when looking at the weather forecast is not to let one icon on your smartphone dictate the whole day.
“That icon does not tell the whole story. It's very easy to see a rain icon and think my whole day is a washout. And that's not necessarily the case.
“[It] could be that you've got a few hours of rain in the morning, that’s then clearing, and then actually the rest of the day you've got sunny skies, rising temperatures and improving picture. So it's very hard to capture the essence of what's actually going on by one single icon and one single temperature figure.”
Watch the video above to learn more about how we monitor heat waves.