As different as they may be, businesses, industries, policy-makers and authorities face the same challenge: integrating the impact of climate change in their future decisions
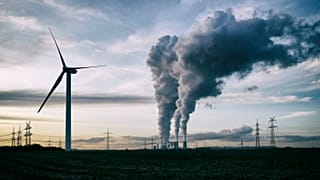
It’s hard to think of an economic sector that climate change will fully spare. Some will be able to leverage the impacts of climate change, but many will have to manage their increased vulnerability. Reducing that vulnerability and adapting to future changes requires understanding the size, timing, and potential impacts of climate risks. In the last decade, access to reliable climate data and predictions has increased in parallel with efforts to tailor that information to the needs of different sectors. That boost created a value chain for climate data that constantly evolves to fit demand and reach new users.
In the last seven years, the Copernicus Climate Change Service (C3S) has played a key role in this value chain. “We cover the big number-crunching to obtain consistent, high-quality data for companies and research organisations who then deliver added-value information for decision-makers,” says Stijn Vermoote, head of user engagement at the European Centre for Medium-Range Weather Forecasts (ECMWF). “It’s a true win-win collaboration, as we gain a lot of insights into how we can improve our service offer as well as boost the visibility and uptake of Copernicus’ products in real-life decision-making processes.”
Several companies supplying climate services spoke to Euronews about how they use climate information to help companies and authorities reduce their climate vulnerability and improve their decision-making for climate adaptation and mitigation.
Daniel San Martin, CEO, Predictia
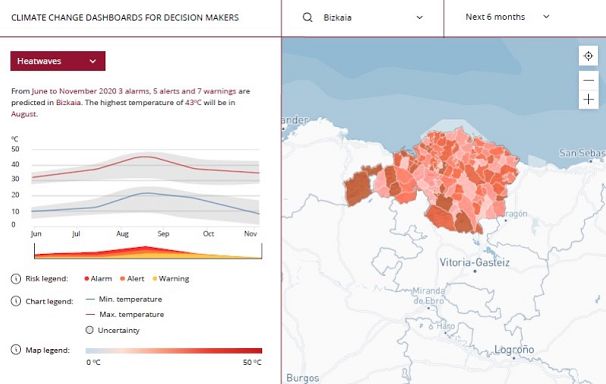
Predictia is a Spanish spin-off company working with the C3S on the ClimAdjust project, which makes climate projections usable for real-life decision making.
Who are your users, and how do they benefit from ClimAdjust?
Our users work in renewable energy, built environment, urban planning, among others, and we are aiming at those who are already developing climate models in these fields. These users need these local, actionable projections data, and have the technical background to handle huge climate datasets, so they can benefit more easily. Climadjust provides climate data and helps users process raw data available from climate models to obtain projections at a scale useful at local and regional levels. Usually, users would need to get projections from external providers, set up cloud platforms to make the statistical calculations and code. But ClimAdjust is user-friendly, providing everything you need in one place.
How can cities make the best use of climate data, given that they have to manage more than one sector – utilities, pollution, climate, infrastructure, etc.?
Collaboration is key. And for that, we need diversity, resources and many more opportunities to work together across fields. For example, that means we can provide our expertise as climate and weather modellers but, to offer useful adaptation measures, we need to pair up with urban planners so they can tell us more about how land use in cities will change: with ecologists, botanists and biologists to tell us how climate and biodiversity are intertwined, with hydrologists to take into account water management, etc.
What are the challenges in getting more users to use climate data and help them understand it?
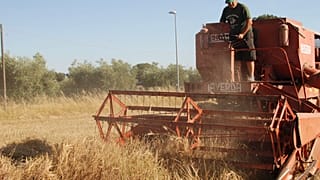
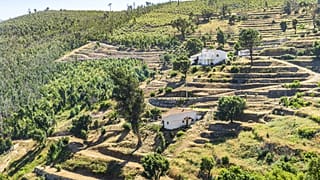
The climate services market is still in its early days. Many people who need climate data don’t know what possibilities the field offers, so communication remains a big barrier. To help people understand why climate projections are useful, we provide examples of how Climadjust can help. One case is the Barcelonnette region in the French Alps, which is prone to landslides, so having precipitation projections that are relevant to the reality on the ground is key for taking protective measures. In Cantabria, Spain, rising temperatures threaten the region’s staple potato crop, so climate data becomes essential for agricultural adaptation.
## Gil Lizcano, Climate Scale co-founder
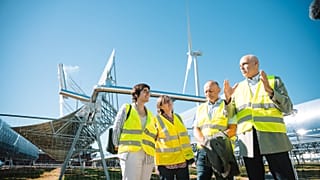
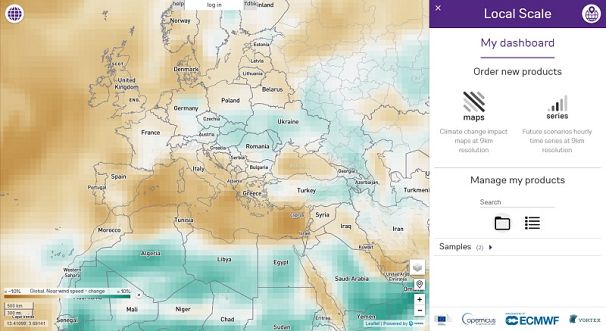
Vortex, a Spanish company providing wind speed and solar radiation modelling services, helps customers better plan and safeguard renewable wind energy projects by providing climate variability information. Vortex uses C3S data for its Climate Scale project, which provides downscaled (detailed, local-level) climate information for risk assessments and adaptation plans.
Who are the main customers for Climate Scale?
They include analysts, consultants, developers, investors in renewable energy who want to know how climate change will impact wind and solar resources, i.e. changes in wind speeds that could affect wind farm viability or turbine design. Companies worried about how climate change might impact their operations are also using Climate Scale. Recently, lenders have also started asking for climate risk impacts for their due diligence process and investors in real-estate for high-resolution data, as they are concerned, for instance, about potential changes in flood-risk.
How has downscaled data served climate risk assessments?
Finance specialists want to know how physical hazards will affect individual assets, so they need high-resolution information about chronic and acute changes. Within the energy sector, hydropower production is a good example of using high-resolution data to analyse climate change impacts. Models for river flows and water availability depend on information about temperature, precipitation, humidity, etc., and are very localised. Thus, the need for downscaled data.
Are there any challenges in getting users to uptake climate data or use it for more applications?
Users are aware they need to explore climate risks, but many are unclear about how to use climate information. Many also don’t know how to include the uncertainties in climate projections in their decisions. One recurrent question is: what if the information changes in the future? There is a need to communicate the ‘evolving’ character of climate science. Rather than expecting to reduce the uncertainty, the focus should maybe be shifted to ‘living with and managing the uncertainty’.
Efren Feliu Torres, Tecnalia climate change manager
Tecnalia is a Spanish company developing tailored R&D and innovation projects for businesses. Their Thermal Assessment Tool, based on C3S data, lets users assess the magnitude of extreme weather events, while their Forest Forward tool provides data on climate change impacts on the distribution of valuable tree species within the forestry sector. They also use C3S data to supply reliable climate information on the impact of extreme climate and weather on infrastructure.
Increased heat wave frequency is making its mark on cities. How does the thermal assessment tool help cities adapt and mitigate future changes in local weather?
The Thermal Assessment Tool includes both long-term projections and seasonal forecasts. Projections are used to analyse future changes in extreme event patterns and design policies and interventions that improve long-term resilience and response capacity. On the other hand, seasonal forecasts can help, for example, local authorities prepare a heatwave response campaign for the season ahead.
What are the main benefits of the Forest Forward service, and how do we translate the data into better forest management practices?
Forest Forward offers long-term projections of climate variables, such as temperature and precipitation, and their spatial distribution. These are useful for identifying and investing in areas that would be favourable for forests in the future or planning which tree species to use depending on future conditions. Other types of long-term information could support the estimation of the demand for heating in buildings and the amount of biomass needed.
You also support critical infrastructure planning with climate data and support climate-proofing, i.e. ensuring the viability of a structure even with future climate change. How can users understand and extract detailed climate information for decision-making?
In the future, infrastructure will be operating under different climate conditions. This justifies the climate-proofing concept: new designs will ensure infrastructure remains functional in the long term, while maintenance and operation will be viable under future climate conditions. For that, planners, designers and operators need to use not only historical records and typical weather conditions, but also climate projections. This will ensure the design phase takes into account future changes in the climate.
How does Tecnalia view the future market for climate data use? What will be its main drivers?
There is a growing market for climate services, and climate projections are increasingly used. Multiple stakeholders will play a role in the complete value chain of climate services (up and downstream). Some of the main drivers in this uptake relate to market forces and business interests, investors’ preferences, regulations, incentives, fiscal policies, and many more.
Gunter Zeug, Director, Terranea
Terranea is a German company that uses data from various sources to develop applications that inform decision-making in sectors such as urban development, agriculture, or insurance. Their Green Cities project is currently piloting different tools that can help cities manage better their green spaces. Another application for assessing climate change impacts on the cotton industry, developed with C3S, is due for launch soon.

How does the Green Cities project help cities’ usage of data?
Climate change is hitting urban environments heavily, and cities have to act. But so far, they don’t fully understand how climate change affects them to make the right changes in their infrastructure. We decided to look into how to manage the huge amounts of data that could be useful for cities. The tree mapping tool we are piloting is meant to help cities automatically update their tree inventory. Cities could also use our tools to map the best places for developing rooftop gardens or keeping track of their sustainability indicators.
How can cities use the HeatMonitor you provide?
In Europe, the number of hot days has been increasing, heavily affecting health and air quality. We use satellite data to provide surface temperature information across a city, measuring how hot are the natural and built surfaces. This information can be purely informative, but you could also overlap it with a green infrastructure map and make a stronger argument for expanding green areas in cities. So the HeatMonitor is basically a visual tool, but cities can also use it for decision making.
In your project with C3S, why do you focus on cotton and what added value does this bring?
The idea is to provide people with a global view of where the cotton is grown and how those areas might change due to climate change. There is evidence that temperatures will increase and water regimes will change in many cotton-growing regions. If you’re a grower, you will want to know if in 30 years you will rely on irrigation to get the same yields, or you’ll have to move your crop. The tool provides historical data, as well as climate projections.
When it comes to climate change adaptation and the different sectors affected, it is not enough to look only at farmers but to investigate the whole value chain, including traders and consumers. The latter are increasingly concerned about sustainable sourcing, so they can also use the tool to understand how sustainable is the cotton going into their clothes.
Stijn Vermoote, head of user engagement, ECMWF/Copernicus
Can we say that climate data is now integrated into decision-making processes?
Getting climate change on top of entrepreneur’s and authorities’ agendas is still challenging. Climate services need to provide tailored, user-friendly tools and explain why climate data matters to particular sectors. In this context, strengthening the supply chain of climate data and customising it to the myriad of demands out there will be essential if we aim for a climate-resilient society. User uptake is a central aspect in the further evolution of Copernicus Climate Change Service, and companies and research organisations embracing climate services will play a massive role in that.