Copernicus’ European State of the Climate report offers the latest snapshot of the continent’s weather and climate
Despite the overwhelming challenges of 2020, Europe’s climate didn’t go unnoticed last year. Several record-breaking weather events and the influence of global and regional climate characteristics marked Europe’s seasons, while data showed Europe is on a clear warming path.
Just released by the Copernicus Climate Change Service, the 2020 European State of the Climate (ESOTC) report reviews the main climate patterns and weather events of 2020 across Europe, highlighting changes and variability, as well as putting the data into a more global perspective. This is also the first time the ESOTC report expands its focus beyond Europe to the entire Arctic region, whose climate can play a significant role in Europe’s climate.
Europe’s warmest year on record
2020 was Europe’s warmest year to date, as temperatures rose by almost half a degree above previous records. Across the entire continent, mean temperatures exceeded the 1981-2010 average, with parts of northern and eastern Europe being more than 2°C warmer. The same regions had higher than average daily minimum temperatures, while France and Benelux countries saw higher daily maximum temperatures.
“We’ve had some periods of exceptionally high temperatures, heatwaves in summer and a warm spell in autumn, though they were not as intense, widespread and long-lived as in recent years,” says Dr. Francesca Guglielmo, senior scientist at the Copernicus Climate Change Service (C3S) and one of ESOTC report’s co-authors.
The most striking temperature anomaly was last winter. Cold season temperatures rose on average about 1.9°C above the previous record and 3.4°C above the average for 1981-2010, in what C3S scientists deem “an exceptionally warm” winter. “The number of days in which the temperature stayed below zero throughout the day illustrates this warming,” says Dr. Freja Vamborg, senior scientist at C3S and lead author of the report. “Whether you have a freezing or non-freezing situation in a certain location, it makes a big difference.”
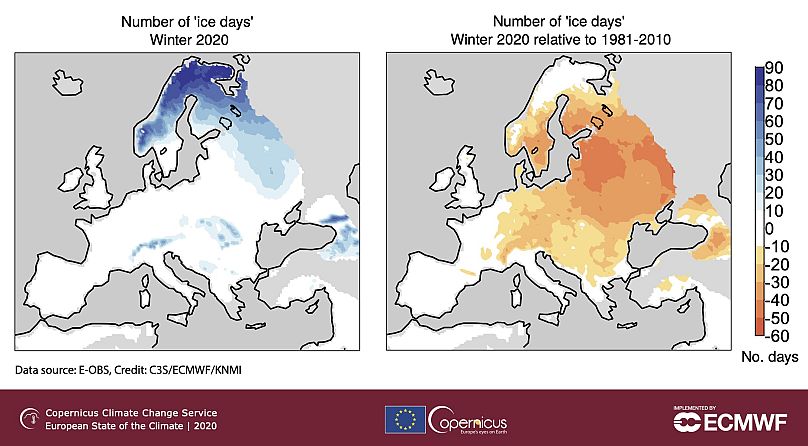
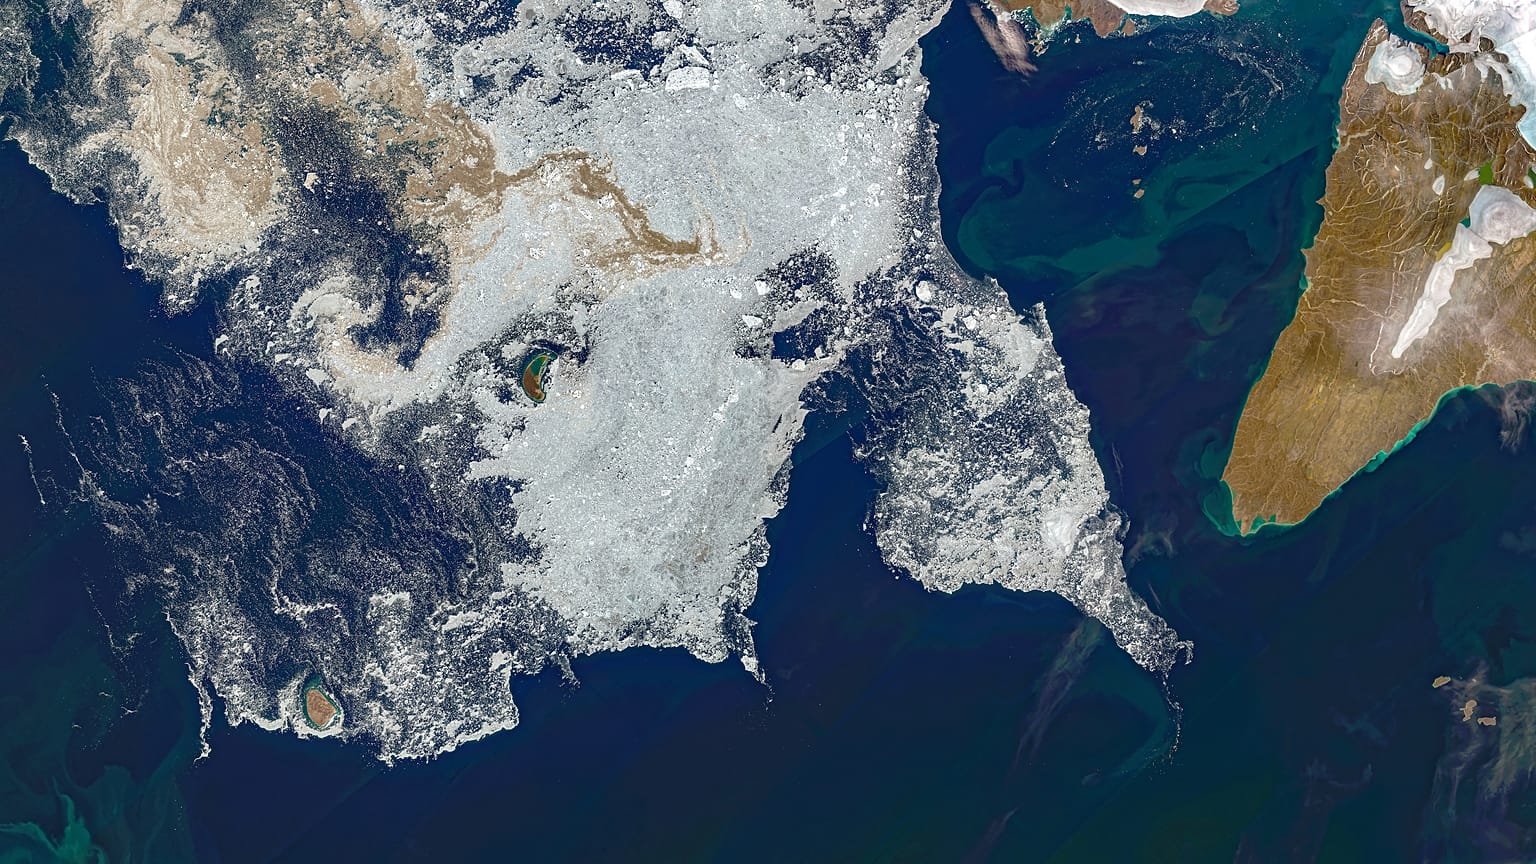
In northern and eastern Europe, conditions were unusual, as winter in the Baltic Sea, Finland and Western Russia was up to 8°C warmer than on average for 1981-2010. This brought the number of days with a risk of serious cold stress to the lowest ever recorded, reducing sea ice cover in the Baltic Sea and the Gulf of Finland. “This winter, the number of days with very strong to strong cold stress during the day was the lowest since the 1980s,” says Dr. Guglielmo. “We’ve had a trend of warming for Europe – so far, we have reached 2.2°C above pre-industrial levels.”
Summer temperatures, however, were not as exceptional as those seen in winter and autumn. Although June in northeastern Europe was especially warm, the Mediterranean region, central Europe and the Balkans, which were heavily impacted by heat in 2018 and 2019, recorded fewer very warm days than on average for 1981-2010.
An abruptly dry spring and a record storm
Only a few events marked an otherwise rather average year for rainfall across Europe. In a wetter than average winter, February saw the highest amount of rainfall of the year, which affected large areas across western Europe and caused rivers, such as the Rhine, to peak early in the month. Then, things changed. “It’s striking how we’ve gone from a wet winter to a dry spring in such a short time,” says report’s co-author Dr. David Lavers, from the European Centre for Medium-Range Weather Forecasts (ECMWF), whose research focuses on the global water cycle. “We see it very clearly in the rainfall, soil moisture and river flows, and this had knock-on effects on vegetation.” According to the report, the lack of rainfall, as well as the below-average cloud cover and high sunshine in spring, which increased water evaporation from soils, produced western Europe’s driest spring in 40 years.

But in October, Storm Alex broke daily rainfall records in the UK and Brittany, as well as in the French and Italian Maritime Alps. In the Maritime Alps, a flow of warm moist air coming off the Mediterranean from the southwest caused landslides and flooding in France and Italy and damaged infrastructure. It was the first time in 40 years that France saw such an intense storm so early in the season and the first time in 70 years that the Italian region of Piedmont recorded such high levels of precipitation. The UK recorded 31.7 mm of rain in 24 hours, marking the 3rd of October as the country’s wettest day in the last 130 years.
Experts say it remains challenging to say whether rainfall events are becoming more extreme across Europe. However, Meteo-France estimates that in the Mediterranean region, there is a 22% increase in the intensity of rainfall in the last 50 years, while the frequency of heavy downpours has almost doubled over the same period.
Low-key wildfires
In a year with below-average wildfire danger, only some regions, such as the Balkans and eastern Europe, saw higher risk in winter and spring, especially as wet conditions abruptly turned dry. Emissions from wildfires were also among the lowest since recording began 18 years ago, with only southwestern France and the Balkans having above-average emissions. Yet summer, which is the typical peak season for wildfires in the Mediterranean region, brought fire emissions well below the 2003-2019 average.
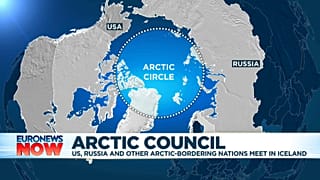
What happens in the Arctic rarely stays in the Arctic
“How warm the Arctic was in 2020 is a key climate signal on a global scale,” says Dr. Vamborg. “It’s one of last year’s main events.” The Arctic was the region with the biggest temperature deviation across the world in 2020, with temperatures 2.2°C above the 1981-2010 average, compared to 0.6°C at the global level.
Arctic Siberia was particularly hit. With a temperature of 4.3°C above average in 2020, it broke by far the records of 2011 and 2016 when the region saw temperatures of about 2.5°C above average. “This warming is certainly part of a trend where the Arctic is warming more rapidly than the rest of the world – at least two to three times faster,” says Dr. Julien Nicolas, C3S reanalysis scientist who also co-authored the report.
“Feedback mechanisms surely played a role in 2020 to make it as warm as it was,” says Dr. Nicolas. “One of them is the albedo effect, which is related to how reflective a surface is. High temperatures led to lower snow cover early in the spring and more rapid melting, exposing the darker ground, which tends to absorb more heat and boost the initial warming. That certainly played a role, especially in the spring when we saw heatwaves over part of Siberia.” Winds, soils that were drier than usual, and widespread fires also contributed to the record heat. Over the Arctic Ocean, the heat also affected the area covered by sea ice, which, in September, reached the second lowest since 1979. Specifically, the sea ice extent was 35% below the 1981-2010 average, while in July and October its extent reached its lowest levels ever for that time of the year.
Wildfires in Siberia also broke records, emitting about 58 million tonnes of carbon into the atmosphere – twice as much compared to 2019, the previous record year. Again, the dry spring, the low soil moisture and the fact that much of Siberia was snow-free in mid-June – one month earlier than usual – caused the wildfire season to start earlier and set conditions that increased its fierceness.
The tight connection between conditions in Europe and the Arctic is one of the reasons the focus of the ESOTC report expanded to cover the whole Arctic region. “You can’t just look at the European Arctic; you have to look at the bigger picture,” says Dr. Nicolas. “What happens in the Arctic also has consequences on Europe’s weather and climate. In fact, the warmth over Europe early in 2020 was part of a larger warm air mass over Siberia. What happened in both regions was part of the same climate pattern.”
Rare ozone depletion up north
“People usually know about the ozone hole in the Antarctic; in the Arctic, conditions are different, and there is less ozone depletion,” says Dr. Nicolas. “2020 was a little different because there was a record ozone depletion event over the Arctic in March and early April. It wasn’t really an ozone hole as in the Antarctic, but it was still the lowest concentration of stratospheric ozone we have seen on record in the Arctic.”
In search of an explanation, the ESOTC report points towards the polar vortex: a ring of powerful winds blowing from the west that circles the North Pole and varies on an annual basis. Its strength influences how much polar air mixes with air from lower latitudes in the higher atmosphere, where ozone forms under certain temperatures. “The polar vortex was exceptionally strong and remained so for longer than usual,” says Dr. Nicolas. “It trapped cold air over the north polar region and didn’t let the air in the north mix with air from mid latitudes, richer in ozone.” These already low amounts of ozone up north were reduced even further at the end of the polar winter when the sunlight returned and started activating ozone-depleting chemicals in the atmosphere.
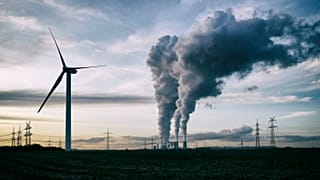
Global greenhouse gas emissions still on the rise
Despite a temporary halt in activities during the COVID-19 pandemic, CO2 concentrations still went up by 0.6% or by roughly 2.3 parts per million (ppm). Although the increase is somewhat lower than in recent years, data showed that atmospheric concentrations of greenhouse gases for 2020 were at their highest global annual average since 2003, according to the Copernicus Atmosphere Monitoring Service’s (CAMS) satellite records. “People may think the slowdown in emissions would show up clearly. However, despite a reduction in emissions, we continued to add a large amount of greenhouse gases into the atmosphere, and as such, their concentrations continued to go up,” says Dr. Vamborg. “It did make a difference, but not that big to be seen. You need that to happen many more times.”
Monitoring annual climate conditions remains essential for understanding the longer-term evolutions of the climate system. Many different types of data are used to compile the information in the report. From satellite to land-based data combined with computer modelling are just some examples of the variety of sources used to improve the confidence of the findings. “Data from last year are in line with expectations that temperatures are going up everywhere,” says Dr. Vamborg. “Record warm temperatures are occurring more often, and it’s important to keep doing this monitoring year after year. It’s this combination of data that shows the trends.”