
Economic losses from climate change-related extremes in Europe are in the billions. Some countries have been hit harder than others.
At COP27, world leaders will be discussing how to take concrete action against the collective threat of climate change. Its impacts have become increasingly more evident with extreme weather such as heat waves, floods, and storms.
These changes are causing losses around the world. In the EU alone, climate change-related extremes caused over €145 billion in economic losses in the past decade.
Between 1980 and 2020, the estimated losses reached almost €500 billion in the EU countries.
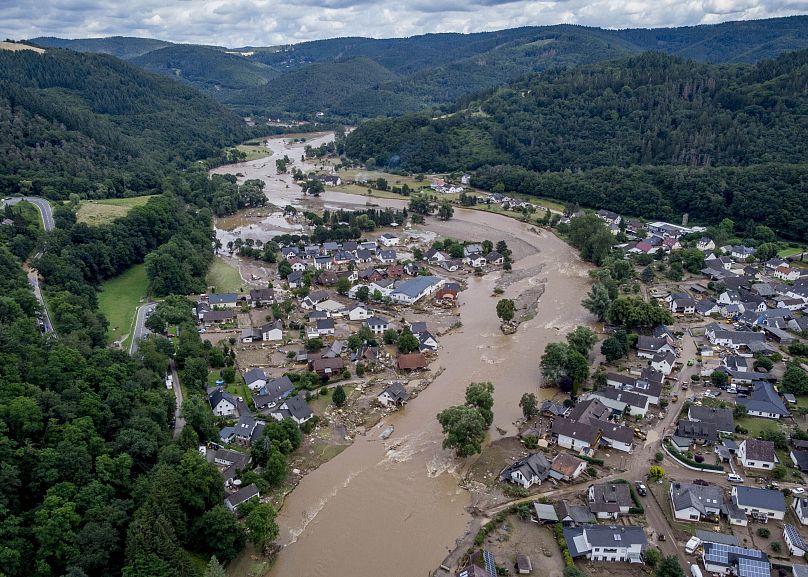
France, Italy, and Germany are being hit the hardest by this extreme weather.
Analysing trends in economic losses is difficult, mostly due to the high variability from year to year. However, the European Environmental Agency (EEA) reports that climate-related extremes are becoming more common as time goes on.
The agency warns that climate change could result in even greater losses in the coming years if mitigating actions are not pursued.
In 2020, the total climate change-related economic losses across 21 EU countries were €12 billion according to Eurostat - not including Hungary, Cyprus, Malta, Latvia, Estonia, and Lithuania where data were not available.
Data suggests a trend of increasing losses in Europe
Between 1980 and 2020, climate-related extremes led to economic losses totalling an estimated €487 billion in the 27 EU Member States. The annual average of the last 40 years is €11.9 billion.
In 2002, the total loss peaked at €38.8 billion, whereas the lowest total loss was observed in 1988 at €1.3 billion.
Losses were also very high in 2017 (€27.9 billion) due to heatwaves causing wildfire conditions.
A comprehensive examination of the EEA's data reveals that the 30-year moving average of climate-related economic losses reflects an apparent rising trend.
The agency estimates an annual increase of nearly 2 per cent over the last decade.
Which European countries have been hit hardest by climate change over the last 40 years?
In 2020, France (€4.2 billion), Italy (€2.5 billion), and Germany (€1.7 billion) experienced the largest economic losses as a result of climate-related events.
They were followed by Greece (€969 million), Belgium (€377 million), Romania (€370 million), Turkey (€356 million), and Poland (€327 million).
So what about the total economic losses between 1980 and 2020?
Among the countries for which data are available, Germany (€108 billion), France (€99 billion), and Italy (€90 billion) once again suffered the most.
These three countries account for 61 per cent of the total losses of the EU in this period. Other countries with remarkable economic losses include Spain (€61 billion), Poland and Switzerland (€16 billion), Czechia (€14 billion), and Austria (€11 billion).
However, data for these countries are not available for all years. Therefore, their actual total losses in 1980-2020 are likely higher than these numbers reflect.
Greece had the greatest economic loss per person in 2020
In 2020, the climate-related economic loss per inhabitant in the EU was €27. On the country level, Greece experienced the greatest loss per inhabitant at €91 in 2020.
France (€62) and Ireland (€42) followed with the lowest loss per inhabitant seen in Bulgaria (€0.70).
Because conditions can be highly variable, however, it's more logical to look at long term trends rather than year-on-year data.
Between 1980 and 2020, the greatest economic losses per inhabitant were recorded in Switzerland, Slovenia, and France while the greatest losses on the country level occurred in Switzerland, Germany, and Italy according to the EEA.
What are climate related events and economic losses?
“Climate-related economic losses” are economic losses occurring as a result of weather and climate related events.
Eurostat defines these as meteorological events such as storms, hydrological events such as floods or mass movements, and climatological events such as heatwaves, cold waves, droughts, or forest fires.
The reported economic losses generally only reflect direct damage to physical assets - this means they are only partial estimates.
The climate-related losses don't include losses in the areas of mortality and health, cultural heritage, or ecosystem services. This means that the true levels of damage are likely to be considerably higher.
EU greenhouse gas production equivalent to 7 tonnes per person in 2020
To mitigate climate change and global warming, global actors in general and the EU, in particular, are making commitments to cut GHG emissions in an effort to halt the rising temperatures.
In 2020, GHG emissions per capita in the EU varied from 0.7 tonnes in Sweden to 16.5 in Luxembourg. The EU average was 7 tonnes.
That is the equivalent of each individual in the EU producing 7 tonnes of GHG emissions that year. It should be noted, however, that these figures were calculated from nationwide totals that include industrial and agricultural GHG emissions as well.
Together with Luxembourg, Ireland, Czechia, the Netherlands, Cyprus, Estonia, Belgium, Poland, Germany, Austria, Denmark, and the United Kingdom also had higher levels of GHG emissions than the EU average that year.
Greenhouse gas emissions per capita fell by 38 per cent in the EU in 30 years
GHG emissions per capita in the EU have gradually declined over the last three decades from 11.2 tonnes in 1990 to 7 tonnes in 2020 - 38 per cent during this period.
Except for Latvia, all EU members have significantly reduced their emissions of GHG in the last 30 years.
Sweden is the country performing best in terms of cutting GHG emissions per capita. This Nordic country decreased its emissions by 83 per cent between 1990 and 2020, followed by Estonia (59 per cent) and Romania (58 per cent).
Cyprus (5 per cent) and Austria (7 per cent) achieved the smallest decreases in this period. Latvia (13 per cent) is the only EU country in which GHG emissions per capita rose.
In Turkey, an EU candidate country, emissions per capita rocketed by 97 per cent. However, Turkey (5.7 tonnes) still had lower GHG emissions per capita in 2020 than the EU average.
The bar race chart above shows how GHG emissions per capita have changed for EU members, the United Kingdom, Norway, Switzerland, Turkey and Iceland over the last three decades.
Iceland has the highest level of GHG emissions per capita - an average of 38 tonnes in 2020.


 and Terry Reintke.")